CV-applied color correction/extraction of soft sweat analyzing pad
Category: Computer Vision, C++
Goal
“The project is to build up a system that accurately detects the concentrations of certain componets such as chloride and hydronium ions, glucose, and lactate in the sweat. The sweat is collected by a soft, flexible, and stretchable microfluidic system on a pad attaching to human skin.
The system detect the concentration in colormetric fashion. By interacting with the chemical compound at the test area, the saturation of the color varies with different concentration.”
The job analyzing the color change and mapping the color to a certain concentration was manually done by human in this program. What I want to do is develping a program that performs equal or better so we get rid of the uncertainties and save the time consuming on this task.
On the other hand, to be able to monitor the changes on one’s health condition, I created an application on the Android platform that not only shows the reading on the fly but also stores the pictures for later in-detail analysis by computer.
Stage 1
The first part of my job is to build up a software which corrects the white balance and the exposure, output the reading at the test area and compare with the reading on the pictures human processed.
So, I have two tasks to tackle at this stage for the comparison.
unify the exposure and the white balanceFind the test area in the picture
Test Area Detection
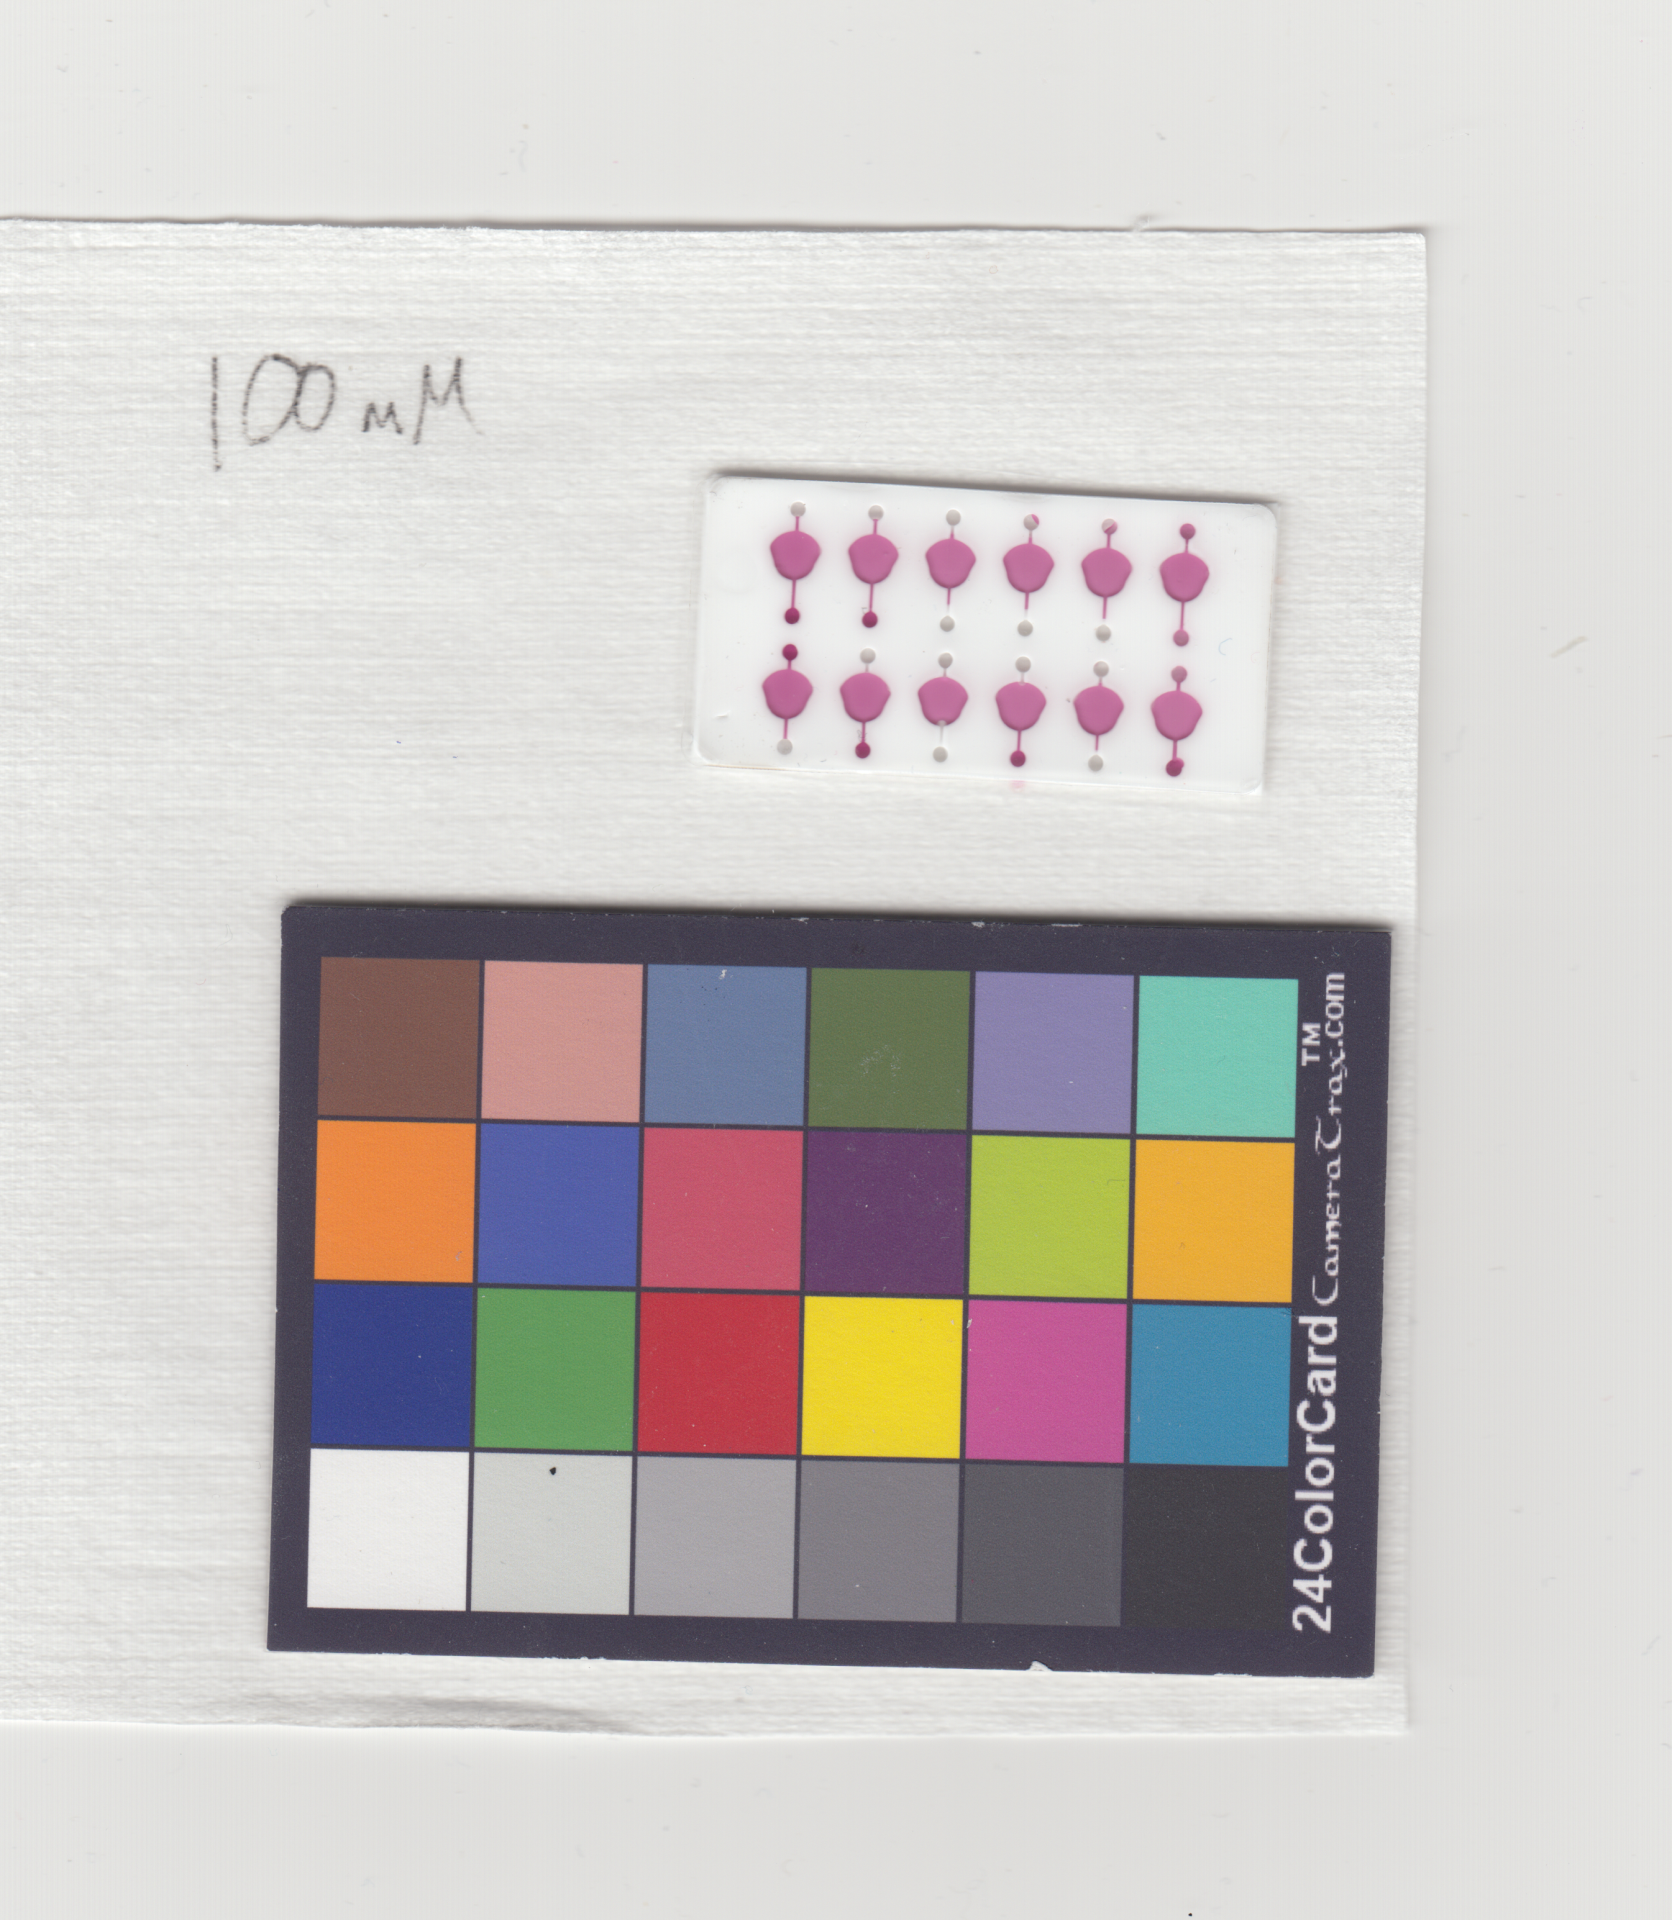
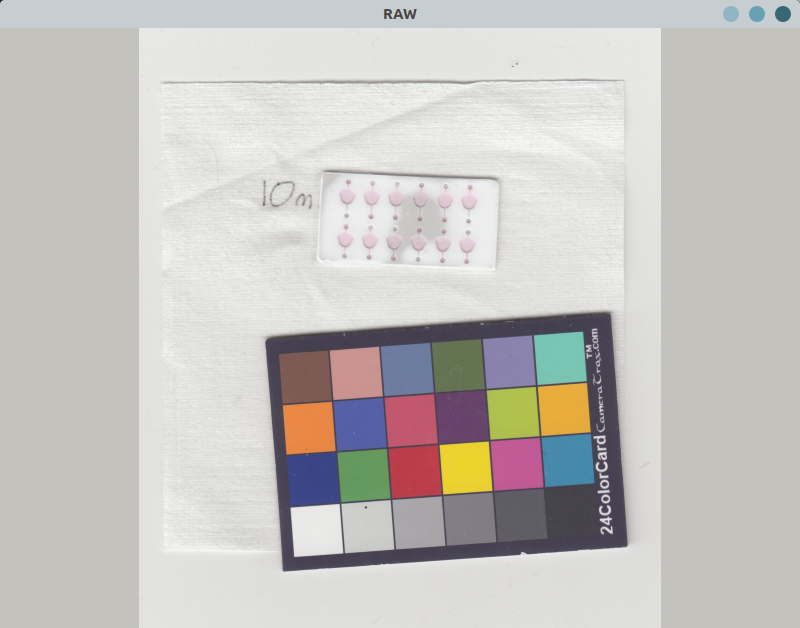
The piture taken for analysis is as in below. At the upper right corner is the pad with 12 test areas to be detected.
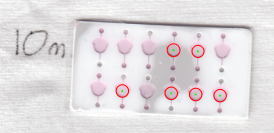
We first extract the feature out with cv::HoughCircles and filter out the tiny holes around the test areas by the radius. In some cases as pictured below when the concentration is low, the contrast of the test area and the test pad is lower. We can’t extract all the areas out with just hough circle. The red circles show area detected.
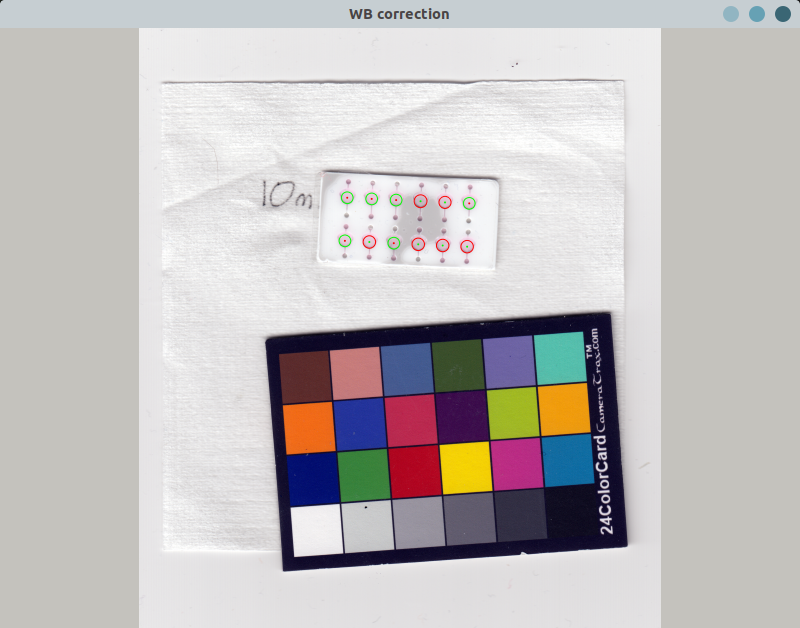
Here is what I did handling such problem:
- I tried to seperate the test areas into two groups and have each group fitting to a line by cv::fitLine
- find the min. spacing and do interpolations between test areas.
- From the left most and the right most points, keep looking for candidates whose HSV valueis within the threshold and stop while no candidates with HSV in the range or hitting the boundaries.
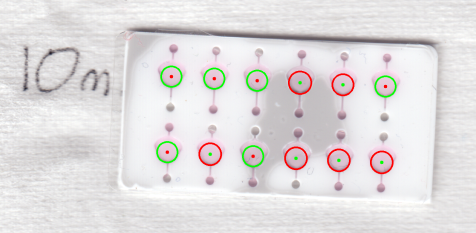
By doing so, we are able to extract all the test area out as shown in below. The green circles are augmented by our algorithm.
White Balance Correction
Here I refer to the method here to do the histogram equalization for color correction.
Here are the steps:
- Split the frame into 3 channels.
- Reshape each channel to an 1-D array and sort it in ascending order.
- Looking for the pixel value of the lowest 1% pixel and the highest 1% one.
- For pixels with value lower that the lower bar, reset their value to the lower bar. For those higer than higher bar, reset them to higher bar.
- normalize each channel and merge them back.
You can find the result below. the upper one is before correction and the lower one is after.
In this case, the white balance of the scanner is stable, so, the color doesn’t change a lot. But, we do improve the contrast of the picture which means we potentially have better resolution within the range.
The Result of Stage 1
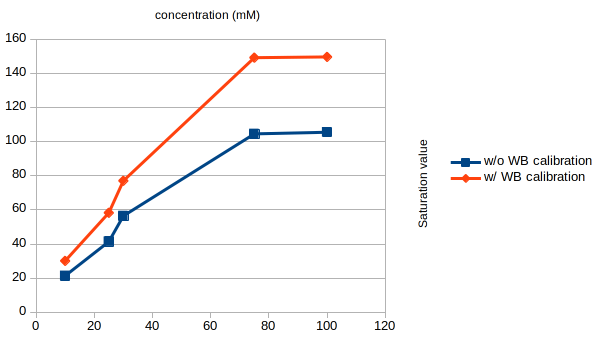
The samples we analyzed is with 10mM, 25mM, 30mM, 75mM and 100mM concentration. The plot below shows the saturation value of HSV with different concentrations. From it, we see that the chemical reaction is similar to linear before 75mM. Higher than that, it looks like the reaction is near to saturation.
We can also find, as mentioned, the correction function improves the contrast from the greater slope.